Introduction
NMR spectroscopy is an incredibly powerful technique for the characterisation and analysis of many chemical compounds. Unlike many other analytical techniques, it is straightforward to distinguish subtle differences in chemical structures. Isomers, compounds with the same molecular formula but different structures, can have varying chemical and physical properties. Understanding isomerism helps introduce safer and more effective drugs and their alternatives. Benchtop NMR spectroscopy distinguishes even between regioisomers, which differ only by the substitution patterns about an aromatic ring.
In this application note, both one-dimensional (1H, 13C) and two-dimensional (1H-1H COSY, 1H-13C HSQC) spectra obtained on the Oxford Instruments X-Pulse Broadband Benchtop NMR Spectrometer are analysed. The differences in the spectra, particularly the aromatic regions, are used to distinguish the three regioisomers of hydroxyacetanilide (ortho-, meta- & para-), demonstrating the ease of differentiating regioisomers of small organic molecules.
The most common isomer, para-hydroxyacetanilide (known as paracetamol or acetaminophen), is regarded as a first line of defence against pain by the World Health Organisation. Paracetamol also has additional antipyretic (fever prevention and reduction) benefits, as well as the ability to combat allergic symptoms when combined with other drugs. Ortho-hydroxyacetanilide also has a variety of uses including as an anti-inflammatory and antirheumatic drug; and while meta-hydroxyacetanilide has yet to been marketed as a drug, it does possess analgesic (pain relieving) properties.
Hydroxyacetanilides
Hydroxyacetanilides consists of acetamido {–NHC(O)CH3} and hydroxy (–OH) groups substituted on an aromatic ring. The various relative substitution positions of two groups around the aromatic ring give rise to three regioisomers: ortho-, meta- and para- (Figure 1). Each isomer can readily be distinguished by NMR spectroscopy, specifically due to the differences in the aromatic regions (δH 6–8 ppm, δC 110–170 ppm) arising from the different substitution patterns.
By inspecting the molecular structures, seven chemically unique hydrogen environments, and eight chemically unique carbon environments can be identified in both the ortho- and meta- isomers. While due to the symmetry around the aromatic ring in the para- isomer (2 & 6, and 3 & 5 are chemically equivalent), there are only five hydrogen environments, and six carbon environments. Since each chemically unique environment is expected to give a single signal in an NMR spectrum, this is the first indication how these isomers could be distinguished.
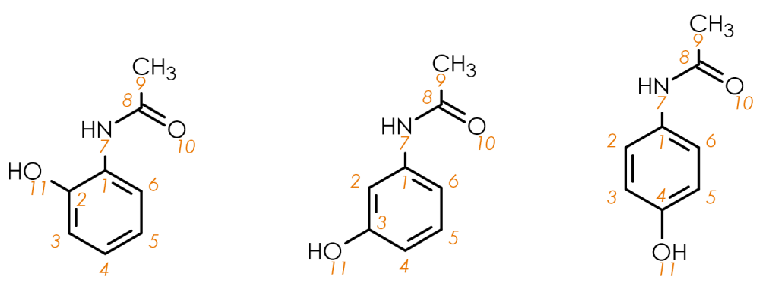 Fig. 1 — Molecular structures for the hydroxyacetanilide isomers, ortho (left), meta (centre), and para (right).
Proton (1H) NMR
The proton NMR spectra of the three hydroxyacetanilides are shown in Figure 2. In all three cases the methyl group 9-CH3 gives a singlet at δH 2 ppm, while the hydroxy 11-OH and amine 7-NH hydrogen give broad signals around δH 9–10 ppm. The compounds can be distinguished by the remaining aromatic signals in the range δH 6–8 ppm.
Each chemically unique hydrogen environment will give a single signal in the 1H NMR spectrum. These signals may be made up of one or more individual peaks, with the number and relative intensities depending on the other nearby hydrogen atoms; in most cases ‘nearby’ means separated by at most three chemical bonds, which usually would be H–C–C–H. For example, considering meta-hydroxyacetanilide, 4-, 5- & 6-CH are close enough together for each signal to comprise multiple peaks; while 2-CH is far enough from any other hydrogen atoms so should give a signal with only one peak. These signals are all present but overlapped in the aromatic region of the 1H NMR spectrum (Figure 2b). The same arguments can be used for ortho-hydroxyacetanilide where all four aromatic hydrogens would be expected to give rise to signals with multiple peaks, which overlap at benchtop frequencies. While for para-hydroxyacetanilide, due to the molecular symmetry there are two signals each of which include two main peaks arising from a single three-bond interaction (e.g., 2-H–C–C–H-3). This allows for para-hydroxyacetanilide (paracetamol, Figure 2c) to be readily distinguished from the other regioisomers.
Due to the signal overlap, to unequivocally assign all three regioisomers by NMR spectroscopy, more information is required in addition to that obtained from a simple one-dimensional proton spectrum.
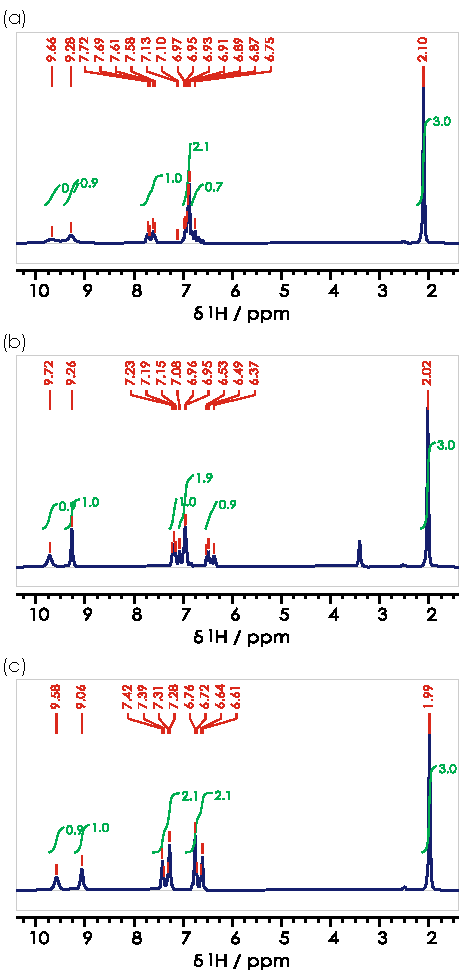 Fig. 2 — 1H spectra for the (a) ortho- (b) meta- (c) para- isomers of hydroxyacetanilide in DMSO-d6.
Carbon-13 (13C) NMR
One option is to look at one-dimensional carbon-13 spectra, since these are obtained proton decoupled, each chemical environment gives a single peak in the NMR spectrum (Figure 3). For all three compounds the methyl group 9-CH3 gives a signal at δC 23 ppm, while 8-CO gives a peak at δC 168 ppm, and the aromatic carbons 1–6 give signals over the range 160–105 ppm.
As with the proton NMR spectrum, para-hydroxyacetanilide can easily be identified, since due to its symmetry there are only four unique chemical environments in the aromatic ring (1-C, 2/6-CH, 3/5-CH, 4-C), and hence four aromatic signals in the 13C{1H} NMR spectrum (Figure 3c).
Both ortho- (Figure 3a) and meta-hydroxyacetanilide (Figure 3b) have six distinct aromatic signals. While it may be possible to assign each of these signals to the appropriate aromatic carbon, using a theoretical understanding of the origin of chemical shifts, doing so is non-trivial and beyond the scope of this application note.
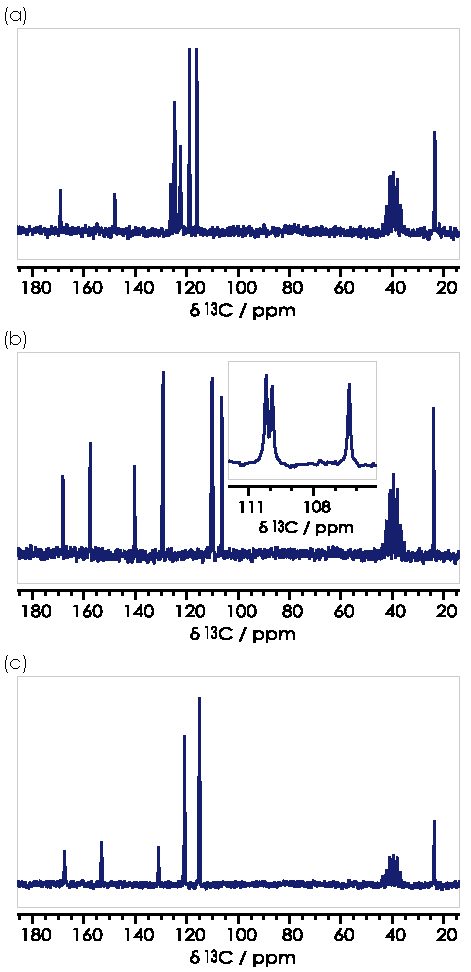 Fig. 3 — 13C{1H} spectra for the (a) ortho- (b) meta- (c) para- isomers of hydroxyacetanilide in DMSO-d6.
Two-Dimensional Spectra
A good amount of structural information can be interpreted from the one-dimensional 1H and 13C NMR spectra. However, by obtaining two-dimensional NMR spectra, the signal dispersion of the 13C spectra, and the information content of the 1H spectra can be combined; to give even more structural information, thereby unequivocally distinguishing the three regioisomers.
1H-13C Correlation Spectra
In a two-dimensional 1H-13C HSQC (Heteronuclear Single Quantum Coherence) spectrum, one-dimensional 1H and 13C spectra are shown along the x- and y-axis respectively; and the cross peaks correspond to one-bond 1H-13C interactions. This allows us to match up any 13C environments to their corresponding 1H environments.
The aromatic regions of the 1H-13C HSQC spectra for the three hydroxyacetanilide regioisomers are shown in Figure 4. In all three cases by showing the data in two-dimensions, each signal is clearly resolved, and the three regioisomers can be easily identified and distinguished.
Once again, the easiest isomer to identify is para-hydroxyacetanilide (Figure 4c), where the two signals are clearly distinguished, and appear as two peaks. Whereas for both the ortho- (Figure 4a) and meta- (Figure 4b) isomer, four signals are clearly observed in the two-dimensional HSQC spectrum. These can be distinguished by the presence of a signal comprising a single sharp peak for meta-hydroxyacetanilide (δH +6.96, δC +109.9 ppm), which corresponds to 2-CH; while all the other signals in the HSQC show clear broadening (or multiple peaks) in the 1H dimension, due to interactions between adjacent CH groups in the molecules.
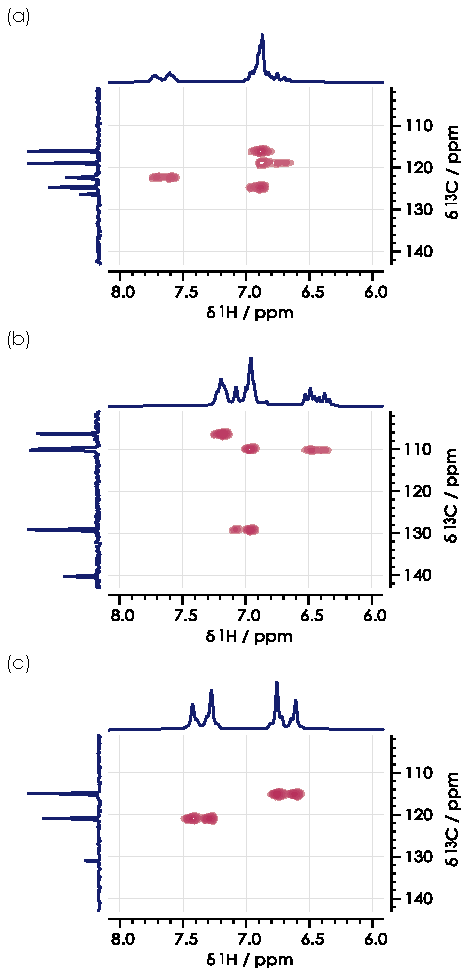 Fig. 4 — Aromatic regions of 1H-13C HSQC spectra for the (a) ortho- (b) meta- (c) para- isomers of hydroxyacetanilide in DMSO-d6.
1H-1H Correlation Spectra
Another type of two-dimensional NMR spectrum which could be used to distinguish regioisomers is a 1H-1H COSY (Correlation Spectroscopy) spectrum. Off-diagonal signals are present in the spectrum when there is coupling between 1H NMR signals (which gives rise to signals with multiple peaks in the one-dimensional spectrum).
The aromatic regions of the 1H-1H COSY spectra for the three hydroxyacetanilide regioisomers are shown in Figure 5. Unfortunately, in this case, due to the significant amount of signal overlap, they cannot be reliably distinguished.
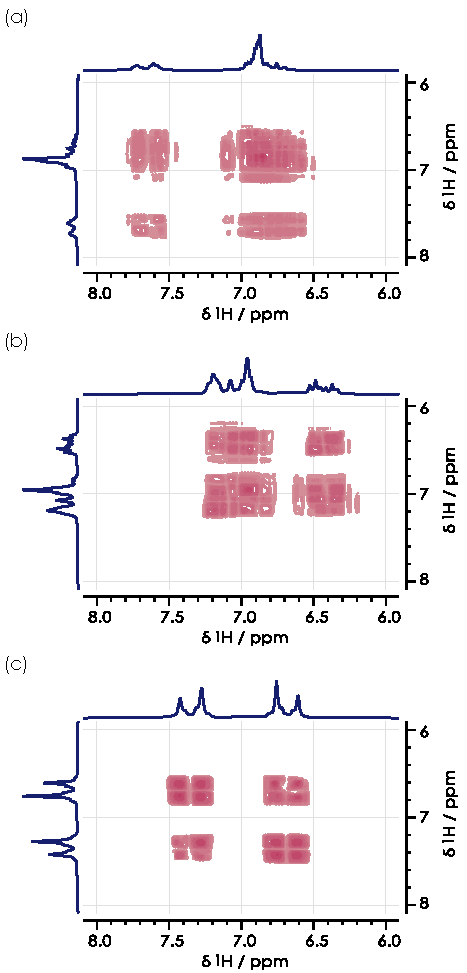 Fig. 5 — Aromatic regions of 1H-1H COSY spectra for the (a) ortho- (b) meta- (c) para- isomers of hydroxyacetanilide in DMSO-d6.
Spectroscopic Data
The fully assigned spectral data of the three regioisomers of hydroxyacetanilide is as follows.
ortho-hydroxyacetanilide
1H NMR (60 MHz, DMSO-d6, +40°C) δH 9.66 (br s, 1H, 7-NH), 9.28 (br s, 1H, 11-OH), 7.80–7.48 (m, 1H, 6-CH), 7.17–6.53 (m, 3H, 3,4,5-CH), 2.10 (s, 3H, 9-CH3); 13C{1H} NMR (15 MHz, DMSO-d6) δC 169.08 (8-CO), 147.96 (2-C), 126.42 (1-C), 124.71 (4-CH), 122.40 (6-CH), 118.98 (5-CH), 116.09 (3-CH), 23.45 (9-CH3).
meta-hydroxyacetanilide
1H NMR (60 MHz, DMSO-d6, +40°C) δH 9.72 (br s, 1H, 7-NH), 9.26 (br s, 1H, 11-OH), 7.31–6.74 (m, 3H, 2,5,6-CH), 6.60–6.26 (m, 1H, 4-CH), 2.02 (s, 3H, 9-CH3); 13C{1H} NMR (15 MHz, DMSO-d6) δC 168.17 (8-CO), 157.55 (3-C), 140.32 (1-C), 129.21 (5-CH), 110.18 (4/6-C), 109.90 (2-CH), 106.35 (6/4-C), 23.96 (9-CH3).
para-hydroxyacetanilide
1H NMR (60 MHz, DMSO-d6, +40°C) δH 9.58 (br s, 1H, 7-NH), 9.06 (br s, 1H, 11-OH), 7.54–7.15 (m, 2H, 2,6-CH), 6.88–6.48 (m, 2H, 3,5-CH), 1.99 (s, 3H, 9-CH3); 13C{1H} NMR (15 MHz, DMSO-d6) δC 167.53 (8-CO), 153.16 (4-C), 130.99 (1-C), 120.93 (2,6-CH), 115.00 (3,5-CH), 23.65 (9-CH3).
Summary
The chemical structures of the three regioisomers: ortho-, meta- and para-hydroxyacetanilide, were elucidated using a combination of one- and two-dimensional NMR spectra obtained by the Oxford Instruments X-Pulse Broadband Benchtop NMR Spectrometer. From these spectra we can clearly differentiate between the three isomers of the same small organic molecule hydroxyacetanilide that contributes to the pain and fever relieving benefits of paracetamol.
The Oxford Instruments X-Pulse Broadband Benchtop NMR Spectrometer is available with a comprehensive range of one- and two-dimensional characterisation sequences and analyses as standard. An optional 25-position autosampler can be used to maximise efficiency and throughput; for example, performing screening studies to identify pharmaceutically relevant target molecules.

