The Raman Principle
The Raman effect is based on the inelastic scattering of light by the molecules of gaseous, liquid or solid materials. The interaction of a molecule with photons causes vibrations of its chemical bonds, leading to specific energy shifts in the scattered light. Thus, any given chemical compound produces a particular Raman spectrum when excited and can be easily identified by this individual "fingerprint."
Raman spectroscopy is a well-established, label-free and non-destructive method for analyzing the molecular composition of a sample.
Raman Imaging
In Raman imaging, a confocal microscope is combined with a spectrometer and a Raman spectrum is recorded at every image pixel. The resulting Raman image visualizes the distribution of the sample's compounds. Due to the high confocality of WITec Raman systems, volume scans and 3D images can also be generated.
No Need for Compromises
The Raman effect is extremely weak, so every Raman photon is important for imaging. Therefore WITec Raman imaging systems combine an exceptionally sensitive confocal microscope with an ultra-high throughput spectrometer (UHTS). Precise adjustment of all optical and mechanical elements guarantees the highest resolution, outstanding speed and extraordinary sensitivity — simultaneously!
This optimization allows the detection of Raman signals of even weak Raman scatterers and extremely low material concentrations or volumes with the lowest excitation energy levels. This is an unrivaled advantage of WITec systems.
- Sensitivity: A high confocality increases the signal-to-noise ratio by reducing the background. With the UHTS Series, WITec developed lens-based, wavelength-optimized spectrometers with a spectral resolution down to 0.1 cm-1 relative wavenumbers.
- Resolution: Lateral resolution is physically limited to ~200 nm, depending on the wavelength of the incident light.
- Speed: The more sensitive a system is, the shorter the acquisition time for a single spectrum. WITec's Ultrafast Raman Imaging reduces acquisition times for single Raman spectra down to well below 1 ms.
Confocal Raman Imaging of Living Cells
Being a non-destructive microscopy technique, confocal Raman imaging is well suited for the study of living cells in their physiological surroundings without damaging them. It can analyse their structure and bio-chemical composition without requiring staining or extensive sample preparation.
Here, epithelial rat cells were investigated with a WITec alpha300 Raman microscope system. After a suitable cell was identified (Fig. 1A), complete Raman spectra were acquired at every pixel of the image (scan range: 40 x 40 µm2, 100 x 100 pixels, 10,000 spectra). Of all spectra obtained, three, shown in Fig. 1B, were identified as being typical for mitochondria (blue), endoplasmic reticulum (green) and nucleoli (orange). Based on these spectra, a color-coded Raman image was generated that visualizes the organelle locations in the cell (Fig. 1C). Different parts of the cell such as the endoplasmic reticulum are clearly distinguishable and even the nuclear membrane is well-defined.
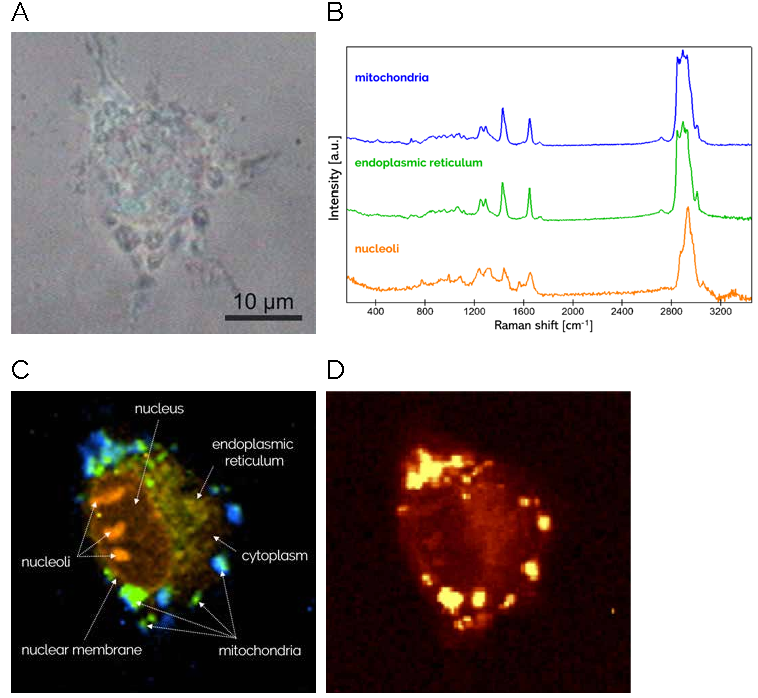
Fig. 1 — Raman imaging of a living rat cell. (A) Video image of epithelial rat cell in culture. (B) Determination of basic spectra from mitochondria (blue), endoplasmic reticulum (green) and nucleoli (orange). (C) Color-coded Raman image generated from the basic spectra. (D) Intensity of the C-H stretching band at 2800 – 3000 cm-1 (rel. wavenumbers). Sample courtesy of Angelika Rück, ILM, Ulm, Germany.
A different method of data analysis calculated the integral intensity of the C-H stretching band at 2800 – 3000 cm-1 (rel. wavenumbers). The resulting quantitative heatmap is shown in Fig. 1D.
Thus, confocal Raman imaging allows detailed and spatially resolved chemical characterization of biological samples.
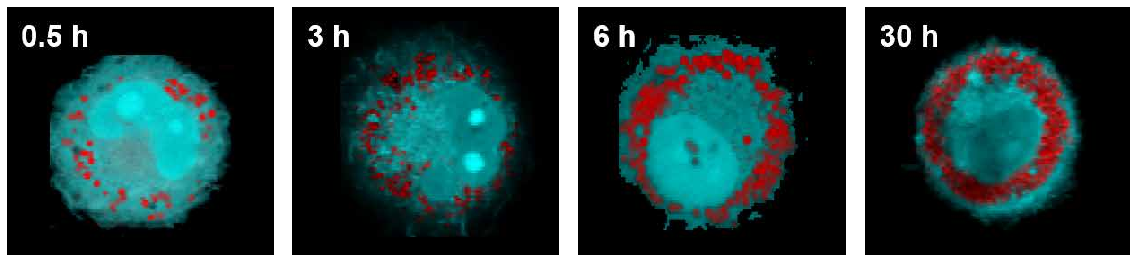
Fig. 2 — Raman images of macrophage cells acquired by integrating over the 2401 cm-1 C-D stretching band of deuterium-marked oleic acid (red) and the C-H stretching band at 2800–3020 cm-1 (blue). After 30 hours of incubation time, the cells store excessive lipids and develop into foam cells.Images courtesy of Christian Matthäus, Leibniz Institute of Photonic Technology, Jena, Germany.
Studying Drug Delivery in Macrophages
The monitoring of living cells is essential for unraveling dynamic processes in cells and tissues. Raman studies showing the uptake of lipids into macrophages in real time were successfully performed by the group of Prof. Jürgen Popp at the Leibniz Institute of Photonic Technology in Jena [2].
Macrophages take up low density lipoproteins (LDL) for recycling and removal. If their export capabilities are overextended, the cells store lipids and develop into foam cells. These foam cells contribute to cardiovascular diseases such as atherosclerosis. With real-time Raman imaging it was possible to follow the dynamics of lipid uptake into macrophages observed over a period of more than 35 hours, revealing striking cell-to-cell heterogeneity. In previous studies, the uptake of lipids into macrophages was studied in fixed cells. Oleic acid was labelled with deuterium. For quantification of its uptake, C-D-stretching vibrations at 2050 – 2275 cm-1 (rel. wavenumbers) were evaluated. The images clearly show that the lipid concentration increases over time and that the fatty acid is stored in droplets (Fig. 2). The appearance of lipid droplets is a hallmark of foam cell formation.
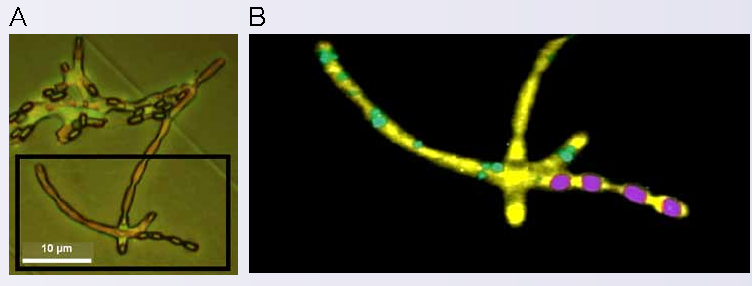
Fig. 3 — Raman imaging of Bacillus cereus. (A) Video image of growing Bacillus cereus. (B) Raman image showing vegetative cells without PHB in yellow, with PHB in green and spores in purple.Images courtesy of Antje Hermelink, Robert-Koch-Institute, Berlin, Germany, modified from [3].
Bacteria in the Focus of Raman Microscopy
Raman imaging has also proven very useful in examining the microbial world. With this technique, bacteria species can be distinguished and their physiological status and growth as well as their response to drug treatment can be analyzed.
Here, a strain of Bacillus cereus was investigated with Raman images being acquired at a spatial resolution of 320 nm using a 532 nm laser. The video image (Fig. 3A) shows a part of the bacterial colony. Raman microscopy (Fig. 3B) distinguishes between vegetative cells without (yellow) or with the storage polymer polyhydroxybutyrate PHB (green) from spores (magenta). The different components were defined by the Ca-DPA Raman band at 1018 cm-1 (rel. wavenumbers) for spores, the C=O stretching vibration band at 1773 cm-1 for PHB and the CH-stretching band (2800–3000 cm-1).
Generative cells can only develop after the bacteria have grown to the stationary phase and accumulated enough PHB. The fact that all three components can be easily detected highlights the diagnostic power of confocal Raman imaging for identifying phenotypic heterogeneity at a single-cell level.
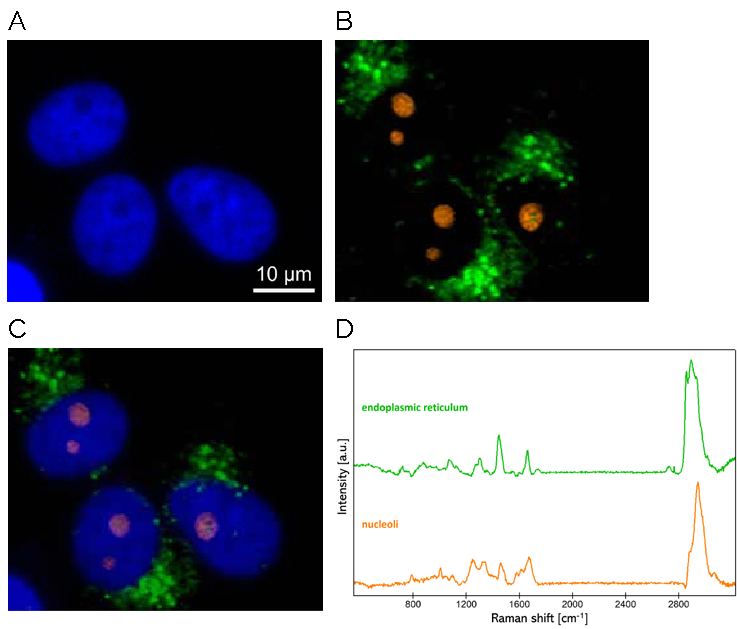
Fig. 4 — Correlative Raman – fluorescence microscopy imaging of eukaryotic cells. (A) Nuclei stained with DAPI (blue). (B) Raman signals identified the endoplasmic reticulum (green) and nucleoli (orange). (C) Overlay of fluorescence and Raman images. (D) Raman spectra corresponding to nucleoli (orange) and endoplasmic reticulum (green). Sample courtesy of Claudia Scalfi-Happ ILM, Ulm, Germany.
Combining Raman with Fluorescence Microscopy
In a wide range of research areas within life science, visualizing specific molecules via fluorescent labelling is still the gold standard. Even though Raman imaging can resolve molecular components of a sample without using fluorescent markers, some applications still require the use of fluorescent techniques.
With this example, we demonstrate the possibility of combining both techniques despite the fact that fluorescence is considered an obstacle of Raman imaging due to the Raman effect's faint signal in comparison to fluorescence.
Raman imaging was done on DAPI-stained cells (Fig. 4A) using an alpha300 Ri inverted microscope system. DAPI is a fluorescent dye with the emission in the blue part of the spectrum, that stains nuclei of eukaryotic cells. By performing Raman imaging using a different wavelength (532 nm), other cytosolic components such as the endoplasmic reticulum (green) and nucleoli (orange) were identified (Fig. 4B), without the interference of the fluorescence signals. Characteristic Raman spectra for the two compounds are given in Fig. 4D.
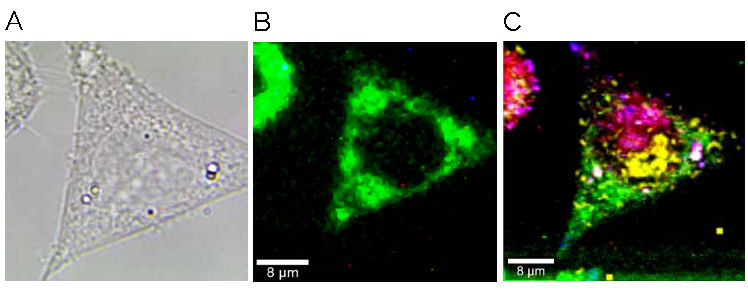
Fig. 5 — Correlative fluorescence and Raman microscopy of eukaryotic cells. Visualization of a chinese hamster ovary (CHO) cell stably expressing GFP in mitochondria. (A) Video image. (B) GFP signal in fluorescence imaging. (C) Color-coded Raman image based on spectra acquired at every pixel. Sample courtesy of Claudia Scalfi-Happ ILM, Ulm, Germany.
Another correlative Raman-fluorescence investigation was carried out on chinese hamster ovary (CHO) cells expressing a mitochondrial-located green fluorescent protein (GFP). In Raman imaging, 14,000 spectra were acquired, one per pixel. The color-coded Raman image displays the clearly distinguishable cytoplasm (green), nucleus (yellow) and nucleoli (pink, Fig. 5C). Note that the GFP fluorescence (Fig. 5B) did not interfere with the Raman signals.
Label-Free Characterization of Tissues with Raman Imaging
Tissues are the basis for many biological and particularly biomedical investigations. They are essential to represent the heterogeneity and structural complexity of the cellular networks in organisms and to shed light on the combined biological processes within. At the same time, detecting multiple components and processes in tissues with high specificity and spatial resolution is a considerable challenge. State-of-the-art staining-based imaging techniques are not only limited by the availability of matching antibodies and the number of different labels, but are also complicated by the fragility of the specimens in extensive staining procedures and the occurrence of high background signals.
In contrast, Raman imaging, a label-free technique, is well-suited to analyze multiple components simultaneously. It is used for tissue analyses in a variety of biomedical research fields such as cancer research [4, 5], cellular differentiation [6], inflammation [7], neurodegenerative diseases research [8] and obesity [9].
In the following example, organoid cultures were characterized in detail via Raman imaging in a study on bladder cancer drug treatment [10]. The study demonstrates the ability of Raman imaging to resolve even subcellular components and processes.
Bladder cancer organoids were generated from primary tumor specimens and treated with pharmaceuticals at different concentrations. Living organoids were imaged immediately after the treatment without further sample preparation at 37 °C. For this, an inverted WITec Raman system equipped with an integrated incubation chamber and a 532 nm laser was used. Raman spectra were recorded at a resolution of one spectrum per µm.
The study investigated the direct effects of the pharmaceuticals cisplatin (cis) and venetoclay (vtx) on organoids derived from urine (UCO), a bladder cancer cell line (RT112) and a primary tumor biopsy (BCO). With Raman imaging and TrueComponent Analysis (TCA), six components within the organoids were identified (Fig. 6A): mitochondria (red), nucleic acids (blue), cytoplasm (green), lipids (yellow), Matrigel (orange) and an unknown component (turquoise). The respective Raman spectra show characteristic peaks (Fig. 6B) indicating the presence of certain chemicals in the individual components such as cytochrome c (Cyt C), phenylalanin (Phe), amide I bonds, CH2 groups and C=C double bonds.
By analyzing the changes in the component's spectral signatures, the cis-treatment was found to alter the DNA structure. In contrast, vtx affected mitochondrial cytochrome c in BCOs and UCOs, pointing to the drug-induced cell apoptosis via the mitochondrial pathway.
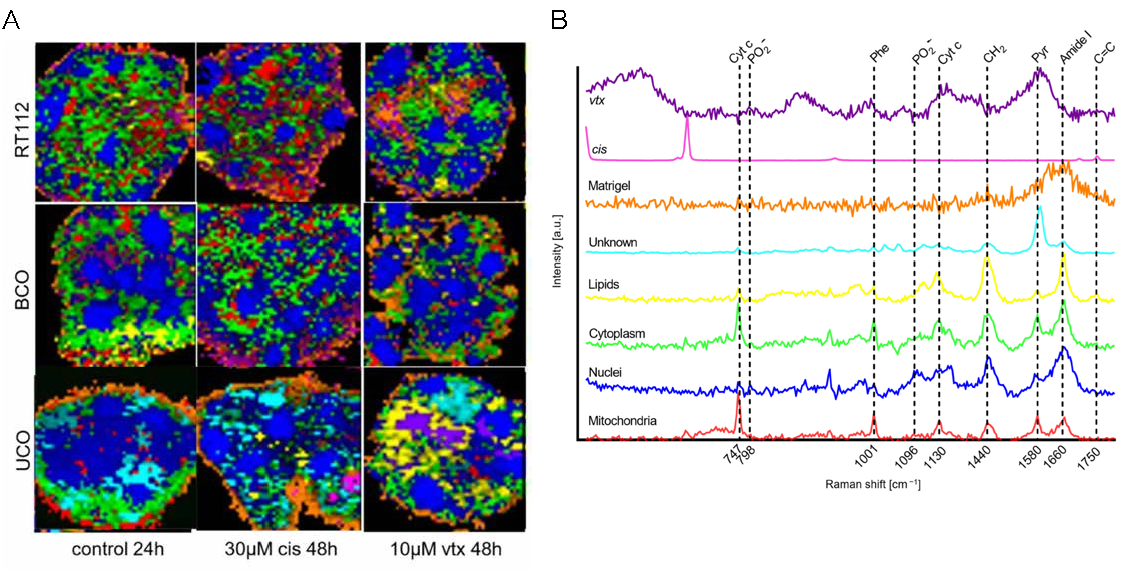
Fig. 6 — Raman imaging of organoid models for bladder cancer. (A) Components in bladder organoids (RT112, BCO and UCO) identified via Raman imaging and TrueComponent Analysis (TCA) after chemical treatments. Scale bar 20 µm. (B) Selected Raman spectra of the identified components. Kindly provided by Julia Marzi, Department for Medical Technologies and Regenerative Medicine, Uniklinikum Tübingen, Germany [10].
3D Raman Imaging of a Zebrafish
For three-dimensional analyses of complex and multilayered biological specimens, instruments with a high confocality that enable data acquisition from individual image planes are required. WITec Raman microscopes feature confocal beam paths by default and enable the imaging of 3D samples at a high lateral and depth resolution. Work from a research group in the UK demonstrates the quality and potential of WITec's Raman imaging technology to analyze entire organoids [11] and zebrafish embryos [12].
Zebrafish are a widely used vertebrate model organism especially as the transparent zebrafish embryos provide the possibility to observe biological processes inside living organisms. While standard labelling techniques are tedious and allow for the visualization of only a limited and pre-defined set of components, this study used Raman imaging as a convenient and comprehensive approach.
Raman spectra were recorded at a lateral and depth resolution of 10 µm throughout the entire zebrafish embryo, providing specific biomolecular and spatial information while maintaining the organism's integrity. The analysis identified three distinct components (proteins, lipids and carotenoids), as visible in a 3D whole-body visualization (Fig. 7A). Their spectra show characteristic patterns (Fig. 7B) with Raman peaks at 2940 cm-1 for CH3 groups in proteins, 2850 cm-1 for CH2 groups identifying lipids and peaks centered at 1159 and 1528 cm-1 from C-C=C-C stretching as in carotenoids.
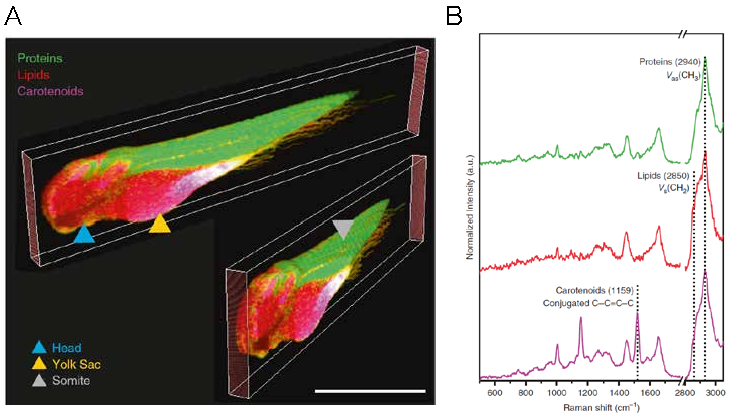
Fig. 7 — Confocal Raman imaging of a fixed zebrafish embryo. (A) Raman 3D imaging of the embryo visualizing proteins (green), lipids (red) and carotenoids (magenta). The head (blue arrowhead), yolk sac (yellow arrowhead) and somite (grey arrowhead) are clearly distinguishable. Scale bar 1 mm. (B) Representative spectra for proteins (green), lipids (red) and carotenoids (magenta).
In Vivo Raman Analysis
In the second part of the investigation, Raman experiments were conducted on living zebrafish embryos. The animals were infected with both a wild type (WT) and a mutant strain (ΔRD1) of Mycobacterium marinum as a model for tuberculosis disease. Their infection and wound healing was tracked with Raman imaging. The viability of the animals during the imaging at 85 mW (785 nm laser) was confirmed by checking for vital signs such as heartbeat and blood flow before and after the scans. Mycobacterial clusters (Fig. 8A) were identified by their distinctive Raman spectral patterns (Fig. 8B), that contain characteristic bands for the presence of proteins (1004 and 1665 cm-1), DNA (789 and 1581 cm-1) and lipids (1065, 1128, 1298, 1439 and 1450 cm-1). For the two bacterial strains, subtle metabolic differences were revealed. Finally, a time-series of volumetric Raman scans in the infected region was used to measure and characterize the wound tissue region. Further information on the study and the results are available in the open-access publication [12].
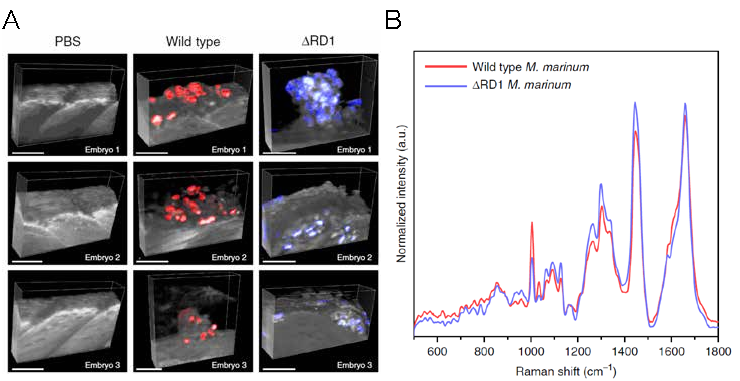
Fig. 8 — Raman imaging of a mycobacterial infection site in zebrafish. (A) 3D Raman images of zebrafish embryos four days after infection with wild type (WT) or ΔRD1 M. marinum, or PBS-treated injection sites as negative control. Mycobacterial clusters are visualized in red (WT) or blue (ΔRD1). Scale bar 50 µm. (B) Average Raman spectra of the M. marinum WT (red) and ΔRD1 mutant strain. Study kindly provided by Prof. Dame Molly Stevens, Institute for Biomedical Engineering and the Department of Physiology, Anatomy & Genetics at the University of Oxford, UK [12].
Evaluating Biological Raman Data
In contrast to some research areas in which samples generally contain few and defined components, life science presents specimens of often staggering complexity. Univariate approaches such as the integration over characteristic Raman bands to analyze the sample's composition can be challenging for some life science applications, as they require a profound knowledge of the spectral footprints for every component. Recent studies in the field therefore explore multivariate data analysis and the translation of omics techniques to best evaluate biological Raman data [11, 13-16].
Multivariate analysis methods including Cluster Analysis (CA), Principle Component Analysis (PCA) and spectra unmixing algorithms such as TrueComponent Analysis (TCA) and Non-negative Matrix Factorization (NMF) are available data analysis options within the WITec Suite software. The TCA is an ideal tool to get from raw hyperspectral data to a meaningful Raman image. It enables an automated as well as manual spectral components detection in the hyperspectral dataset, with the possibility of spectra unmixing and assigning their location in the image. As a result, a Raman image of different components can be created.
Illuminating Complexity in the Structure of Spruce Needles
The following study tested different Raman data analysis approaches to determine which could best visualize the composition of the cuticle and epidermal layers of Norway spruce needles. It compares Raman band integration (univariate approach), Cluster Analysis (CA) and Non-negative Matrix Factorization (NMF) using the same dataset. The Raman imaging was performed on 15–20 µm thick cross sections of the needles at a lateral resolution of 0.3 µm and an excitation wavelength of 785 nm.
Band integration of characteristic peaks is an established tool to detect components including pectin, lignin, cellulose or aromatics. It was possible to highlight structures as the epicuticular layers (Fig. 9A, yellow and orange structures). In CA (Fig. 9B), the upper waxy (orange) and lower cuticle layers (yellow) were clearly identified. However, some information on the chemical distribution in the sample was lost. As such, calcium oxalate (blue), a compound consisting of tiny crystals became less visible. This is related to other components being more prominent in determining the classification of pixels at which several components are present. When applying an unmixing algorithm as NMF in this example, the "purest" spectra of individual components, so-called endmembers (EMs), are identified in the dataset. Their presence is visualized in abundance maps (Fig. 9C). As visible for calcium oxalate (EM2, cyan), this allows for a more detailed view of the complex layering of the sample.
In summary, with Raman imaging and NMF analysis the researchers uncovered the chemical heterogeneity in the cuticle and epidermal layers of the needles [15]. Especially the aromatic components such as coumaric acid and flavonoids were shown to be present in all layers and intermixed with lipids in the cuticle. A further polarization-resolved Raman measurement could identify the orientation of aliphatic chains and coumaric acids in the top crystalline layer.
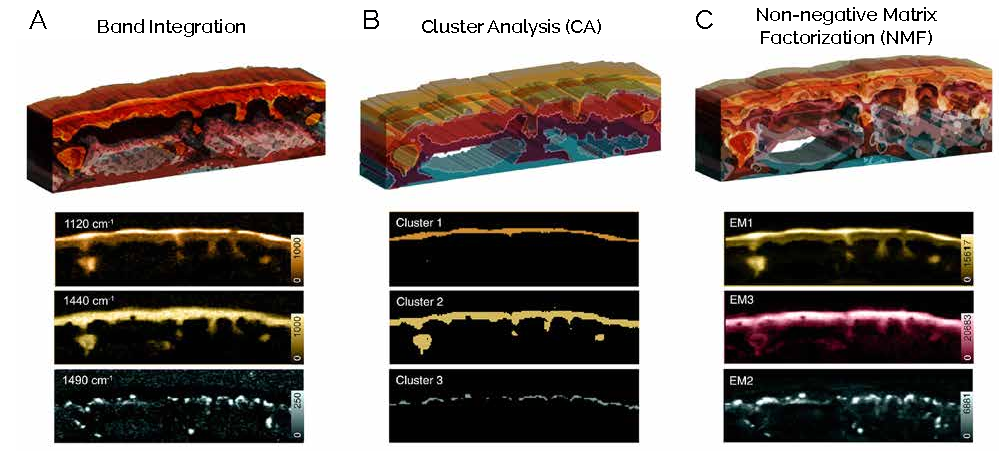
Fig. 9 — Raman analysis of spruce-needle structure by three different methods. (A) Band Integration, (B) Cluster Analysis (CA) and (C) Non-negative Matrix Factorization (NMF) analysis of Raman data. Upper panel: 3D representation of all compounds by each method. Lower panel: Individual Raman images of three identified components including cuticle (yellow), epicuticular wax layer (orange) and calcium oxalate (cyan). Study kindly provided by Notburga Gierlinger, Department of Nanobiotechnology (DNBT), University of Natural Resources and Life Sciences (BOKU), Vienna, Austria. Images adapted from [15].
Raman Identification of Specific Biomarkers in Aneurysms
Raman imaging and multivariate data analysis can also be used to identify biomarkers. This is shown in the following study with the example of ascending thoracic aneurysms (aTAAs). Murine and human tissue samples were imaged using a WITec alpha300 R equipped with a 63x water-dipping objective and a 532 nm laser. Large-area (100 x 200 µm2) and high-resolution scans (murine: 10 x 150 µm2 / human: 50 x 500 µm2) were performed with a 2 x 2 µm2 or 1 x 1 µm2 resolution, respectively.
First, a TrueComponent Analysis visualized the structural features of murine aortic tissues (Fig. 10A). The Raman-based method was able to identify the structures of different extracellular matrix (ECM) components at high spatial resolution in a way comparable to immunostaining approaches (Fig. 10C). In tissue samples of the aTAA murine mutant models Fbln5KO and Fbln4SMKO, elastic and collagen fibers had a disrupted and disorganized shape. In contrast, the wild type (WT) line showed defined structures.
In a second step, the Raman spectral data was further analyzed using Principal Component Analysis (PCA) and Multivariate Curve Resolution (MCR). Together, they could identify the submolecular differences between healthy and aneurysmal aortas. The combined approach separated Raman spectra within the TCA-identified areas of elastic and collagen fibers into subcomponents. This way, alterations in the abundance of individual spectra in diseased and healthy tissues were detected. In collagen fibers for example, a spectrum named Cc6 (Fig. 10D, orange spectrum) was present exclusively in diseased Fbln4SMKO aortic tissue (Fig. 10E). The component Cc1 represents the native collagen fibers (Fig. 10D, red spectrum). In comparison to the Cc1 spectrum, Cc6 contains multiple amino-acid-specific Raman peaks. Especially intense peaks can be found, for example, for tryptophan at 749, 1018, 1336, and 1455 cm-1 (rel. wavenumbers). This indicates changes in the tryptophan metabolism that were induced by the mutation. An aneurysm-specific Raman spectrum was identified not only for collagen, but also for elastic fibers. The researchers could reproduce the results from the mouse samples in human tissue; both spectral signatures were found in human aTAA tissue samples and exhibited significant differences compared to the healthy control [16].
In conclusion, the detailed analysis of the Raman data enabled the detection of characteristic tissue footprints, which are suitable biomarkers for aTAA diagnosis.
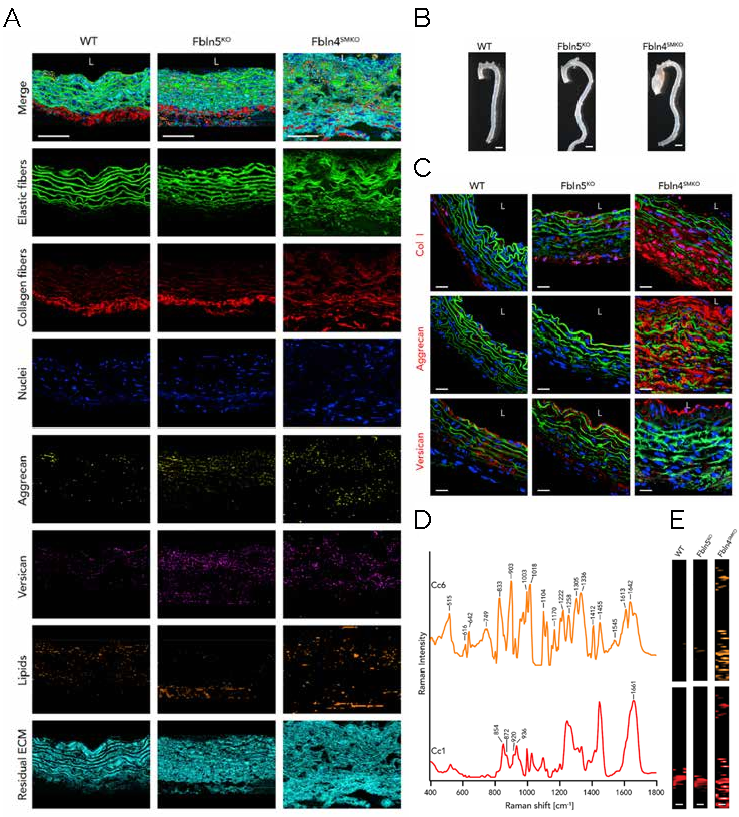
Fig. 10 — Biomarker identification in ascending thoracic aneurysm via Raman microscopy. (A) Raman images of murine ascending aorta tissue from WT, Fbln5KO and Fbln4SMKO visualizing false-color heatmaps for elastic fibers (green), collagen fibers (red), nuclei (blue), aggrecan (yellow), versican (pink), lipids (orange) and residual ECM (cyan). (B) Overview pictures of murine aortas. (C) Immunofluorescence staining showing similar structures as visible with Raman imaging. (D) MCR-identified spectra in collagen fibers for the aneurysm-specific component Cc6 (orange) and native collagen fibers Cc1 (red). (E) MCR images for Cc6 and Cc1. Kindly provided by Julia Marzi, Department for Medical Technologies and Regenerative Medicine, Uniklinikum Tübingen, Germany [16].
Correlative Raman-SEM Imaging in Life Science
Since confocal Raman imaging is a non-destructive technique, it is ideally suited for the combination with imaging techniques including atomic force microscopy (AFM), scanning electron microscopy (SEM), or others. In the presented example, sea urchin teeth were correlatively analyzed using backscattered electrons (BSE) in an SEM (Fig. 11A-C), energy dispersive spectroscopy (EDS, Fig. 11D-F) and Raman microscopy (Fig. 11G-I).
Sea urchin teeth are built up in a complex network of ordered structural elements of calcite including different molar fractions of magnesium (Mg). They were used here as a model organism to correlatively study the spatial distribution of Mg in multiphase systems.
Raman imaging can provide information on the location and concentration of Mg, as higher Mg levels cause peak shifts in the Raman spectrum. In this study, literature values of Raman peak positions in samples with defined concentrations served as a calibration curve and allowed for the calculation of absolute Mg molar fractions (Fig. 11G-I). By analyzing the entire tooth, Raman imaging revealed a "stone region" with high amounts of Mg, flanked by areas with intermediate Mg levels and the keel with low Mg content. BSE analyses identified differences in electron densities (Fig. 11 A-C), which relate back to varying concentrations of Mg in the calcite crystal lattice. An additional EDS image (Fig. 11 D-F) serves as an elemental map, depicting calcium (blue) and magnesium (magenta) in the respective area. Combined, the correlative imaging proved to be a powerful toolset for generating a detailed map of the magnesium incorporation in sea urchin teeth.
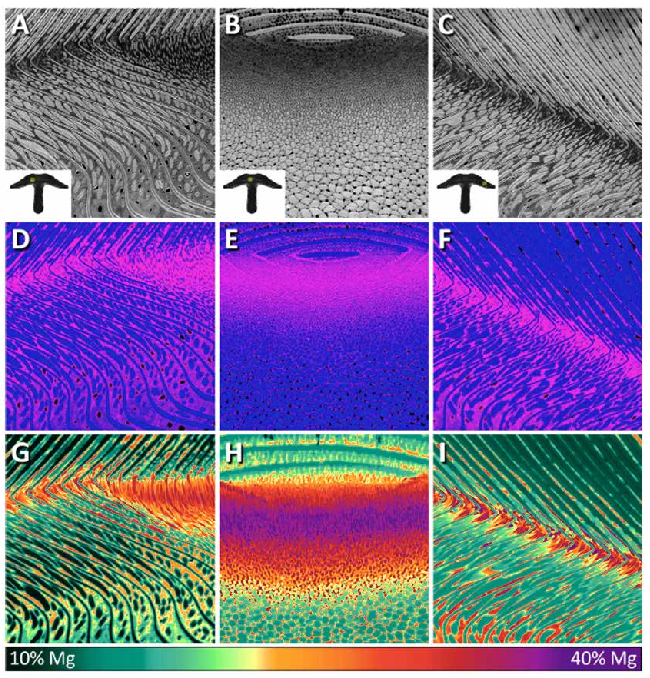
Fig. 11 — Correlative imaging of sea urchin tooth. (A-C) Backscattered electron (BSE) microscopy reveals electron density in different areas of the tooth. (D-F) Energy dispersive spectroscopy (EDS) shows the chemical composition of calcium (blue) and magnesium (magenta). (G-I) Raman imaging illustrates local Mg concentrations. Kindly provided by Admir Masic, Associate Professor at the Massachusetts Institute of Technology, Cambridge, USA, Modified from [17].
RISE™-Microscopy: Correlative Raman and SEM Imaging
RISE™-microscopy is our award-winning technology that combines Raman imaging with scanning electron microscopy (SEM) in one instrument. While Raman imaging identifies and locates the molecular compounds in a sample, SEM reveals the morphology and surface structure of the object from the millimeter range down to atomic resolutions. In RISE-microscopy, the Raman measurements are performed within the vacuum chamber of an SEM. A precise translation stage facilitates the automatic transfer of the sample between the Raman and SEM measuring modes, returning to precisely the same position within the sample. This drastically improves the system's ease of use, especially for structurally homogeneous samples.
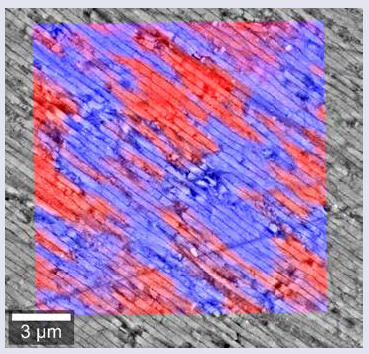
Fig. 12 — RISE-microscopy image of an abalone shell. Mother-of-pearl consists of several crystal forms of aragonite. Different crystal orientations can be distinguished by their Raman spectra. The RISE-microscopy image illustrates how the anisotropy (blue and red) is correlated with the structural features of the material.
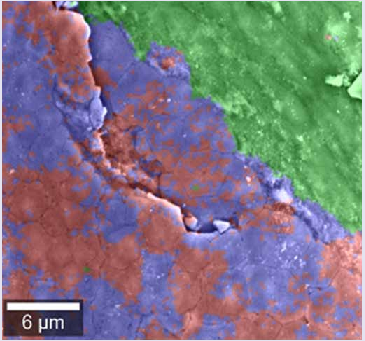
Fig. 13 — RISE-microscopy image of a pearl. Confocal Raman imaging indicates that the pearl consists of two polymorphs of calcium carbonate, namely aragonite (blue, red) and vaterite (green). Structural features were imaged with SEM. The correlation of the information of both techniques results in the RISE-microscopy image.
References
- Toporski, J., Dieing, T., & Hollricher, O. (Eds.). (2018). Confocal Raman Microscopy (Vol. 66). Springer. DOI: 10.1007/978-3-319-75380-5.
- Stiebing, C., et al. (2017). Real-time Raman and SRS imaging of living human macrophages reveals cell-to-cell heterogeneity and dynamics of lipid uptake. Journal of Biophotonics, 10(9), 1217-1226. DOI: 10.1002/jbio.201600279.
- Hermelink, A., et al. (2009). Phenotypic heterogeneity within microbial populations at the single-cell level investigated by confocal Raman microspectroscopy. Analyst, 134(6), 1149-1153. DOI: 10.1039/b822574e.
- Abramczyk, H., et al. (2019). Advances in Raman imaging combined with AFM and fluorescence microscopy are beneficial for oncology and cancer research. Nanomedicine, 14(14), 1873-1888. DOI: 10.2217/nnm-2018-0335.
- Mamede, A. P., et al. (2022). Breast cancer or surrounding normal tissue? A successful discrimination by FTIR or Raman microspectroscopy. Analyst, 147(21), 4919-4932. DOI: 10.1039/d2an00622g.
- Stanek, E., et al. (2022). The distinct phenotype of primary adipocytes and adipocytes derived from stem cells of white adipose tissue as assessed by Raman and fluorescence imaging. Cellular and Molecular Life Sciences, 79(7), 383. DOI: 10.1007/s00018-022-04391-2.
- Czamara, K., et al. (2021). Lipid droplets formation represents an integral component of endothelial inflammation induced by LPS. Cells, 10(6), 1403. DOI: 10.3390/cells10061403.
- Stiebing, C., et al. (2020). Biochemical characterization of mouse retina of an Alzheimer's disease model by Raman spectroscopy. ACS Chemical Neuroscience, 11(20), 3301-3308. DOI: 10.1021/acschemneuro.0c00420.
- Majka, Z., et al. (2021). A new approach to study human perivascular adipose tissue of the internal mammary artery by fiber-optic Raman spectroscopy supported by spectral modelling. Analyst, 146(1), 270-276. DOI: 10.1039/d0an01868f.
- Becker, L., et al. (2022). Data-driven identification of biomarkers for in situ monitoring of drug treatment in bladder cancer organoids. International Journal of Molecular Sciences, 23(13), 6956. DOI: 10.3390/ijms23136956.
- LaLone, V., et al. (2023). Quantitative chemometric phenotyping of three-dimensional liver organoids by Raman spectral imaging. Cell Reports Methods, 3(4). DOI: 10.1016/j.crmeth.2023.100440.
- Høgset, H., et al. (2020). In vivo biomolecular imaging of zebrafish embryos using confocal Raman spectroscopy. Nature Communications, 11(1), 6172. DOI: 10.1038/s41467-020-19827-1.
- Haessler, A., et al. (2023). Unraveling Molecular Composition in Biological Samples – Systematic Evaluation of Statistical Methods for the Analysis of Hyperspectral Raman Data. Analytical Chemistry, 95(48), 17646-17653. DOI: 10.1021/acs.analchem.3c03368.
- Sigle, M., et al. (2023). Translating genomic tools to Raman spectroscopy analysis enables high-dimensional tissue characterization on molecular resolution. Nature Communications, 14(1), 5799. DOI: 10.1038/s41467-023-41417-0.
- Sasani, N., et al. (2021). Raman imaging reveals in-situ microchemistry of cuticle and epidermis of spruce needles. Plant Methods, 17, 1-15. DOI: 10.1186/s13007-021-00717-6.
- Sugiyama, K., et al. (2021). Raman microspectroscopy and Raman imaging reveal biomarkers specific for thoracic aortic aneurysms. Cell Reports Medicine, 2(5).
- Masic, A., & Weaver, J. C. (2015). Large area sub-micron chemical imaging of magnesium in sea urchin teeth. Journal of Structural Biology, 189(3), 269-275. DOI: 10.1016/j.jsb.2014.12.005.

